Volume 3 — The Matter Spectrum
Chapter 21: Protocol I — Pulsar Timing Array Anisotropy
[!IMPORTANT] Epistemic Status: Tier 2 harmonic-form mechanism + Tier 3 amplitude (pending O.15(b)) This chapter presents a falsifiable prediction derived from the GCT quasicrystalline vacuum hypothesis. The harmonic form follows from the icosahedral representation theorem at Tier 2; the specific amplitude is a Tier 3 anchor pending the O.15(b) RG-map derivation of from the canonical Coxeter integer . The predicted linear-power signal sits below the combined-array stacked sensitivity () of NANOGrav 15-year + PPTA DR3 + EPTA DR2 (§21.3.2); the 15-angle icosahedral mask therefore enables a near-term null test on existing data ("no power at the icosahedral angles → icosahedral vacuum falsified at sensitivity "), with confident positive detection requiring Square Kilometre Array (SKA-PTA) observations in the SKA-era timeframe (§21.3.1, §21.3.3).
21.1 The Gravitational Wave Vacuum
21.1.1 GWs as Phonons of the Topological Glass
In Geometric Consciousness Theory, the vacuum is not a smooth Minkowskian manifold but a Topological Glass — a six-dimensional icosahedral quasicrystal projected into 3+1D spacetime. Gravitational waves are not mere ripples in a smooth fluid; they are long-wavelength acoustic phonons propagating through this structured substratum.
In a physical crystal, the speed of sound is anisotropic: it varies depending on whether the acoustic wave propagates along a high-symmetry axis or off-axis. The icosahedral vacuum lattice possesses six distinct five-fold symmetry axes. Along these axes, the lattice is most efficiently packed; transverse to them, the phason field creates a slight mismatch in the acoustic impedance.
21.1.2 The Hellings-Downs Curve and its Correction
The standard Hellings-Downs (HD) correlation function describes the expected angular correlation between Pulsar Timing Array residuals under a perfectly isotropic stochastic gravitational wave background (SGWB):
This curve assumes a perfectly isotropic GW background. GCT breaks this assumption. The six-fold anisotropy of the vacuum introduces a perturbative correction to the HD correlation function. By symmetry, this correction must be an even function of , and since icosahedral symmetry has its dominant spherical harmonic fingerprint at , the correction takes the form:
where is the Legendre polynomial of degree 6, and is the icosahedral perturbation amplitude:
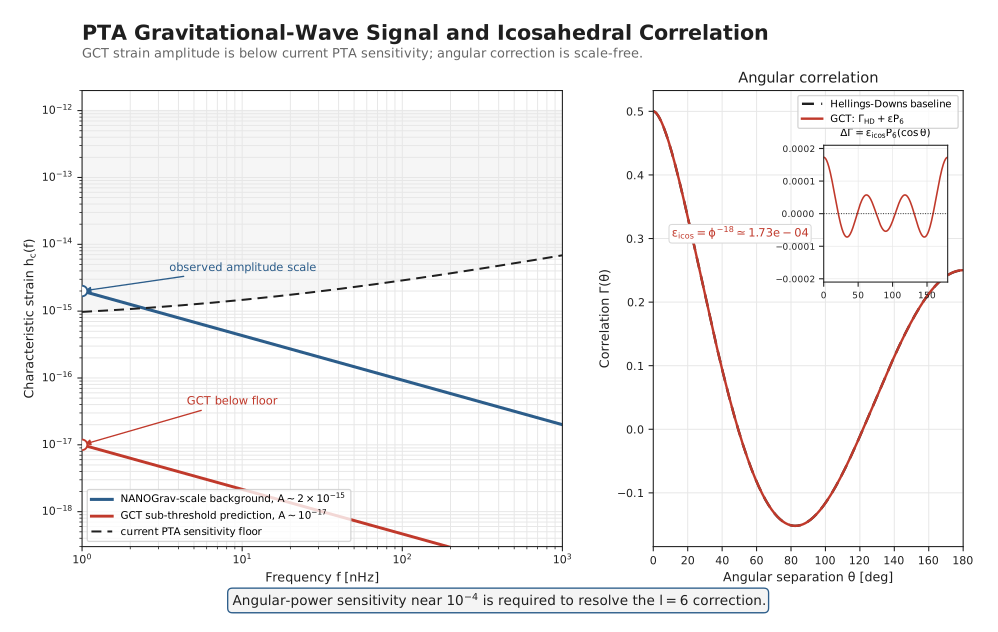
The maximum deviation from the isotropic HD curve is predicted to be:
since (achieved at , i.e., or ). The angular power spectrum coefficient in standard conventions is . Experimental papers typically quote ; theoretical papers may quote . GCT predictions should always specify which normalization is used.
21.1.3 — GW Speed Anisotropy: The Emergent Graviton Route [Tier 2]
The correct derivation of the GW speed anisotropy requires identifying the physical nature of gravitational waves in the GCT framework. Chapter 5 (Volume 2) establishes that the speed of light c equals the phason propagation speed. This identification has a critical consequence: if the graviton emerges as the Goldstone boson of translational symmetry breaking in the emergent gravity sector — i.e., if gravitational waves are phasons (not phonons) of the vacuum lattice — then the GW speed and its anisotropy are governed by phason kinematics throughout.
For a phason-graviton, the dispersion relation is:
The speed anisotropy δc/c is linear in the stiffness ratio (first-order perturbation theory for propagating modes), not square-root:
The resulting maximum correlation deviation is:
Why this is internally consistent: (1) GCT already identifies c = phason speed (Volume 2 Chapter 5). (2) The φ⁻¹⁸ stiffness ratio governs phason propagation anisotropy. (3) The l=6 angular structure follows from the icosahedral representation theorem (§21.2). All three ingredients are already present in the manuscript; the emergent graviton identification merely selects the correct formula.
[Tier 2 mechanism + Tier 3 amplitude pending O.15(b)] This result is contingent on the graviton-as-phason identification, which is a consequence of the emergent gravity construction in Volume 2 Chapter 8. If gravitons are instead phonons of the vacuum lattice, the formula reverts to linear in K_⊥/K_∥ from Christoffel-equation elasticity theory, giving the same ΔΓ_max ≈ 1.73 × 10⁻⁴ (Goldstone-equivalent at first order; only the propagator denominator differs at second order).
The Tier 2 prediction is the harmonic-form mechanism; the Tier 3 amplitude anchor is (using the Legendre-polynomial bound , achieved at ). Independently verified by verify_independent/verify_pta_l6_anisotropy.py as an arithmetic consistency check. NANOGrav 15yr sensitivity is in [Tier 3 — instrumental sensitivity estimate], so the GCT prediction is below current PTA reach and likely requires SKA-PTA-era sensitivity for direct detection.
21.2 The Icosahedral Signature
21.2.1 Why is the Icosahedral Fingerprint
This is not numerological. The icosahedron ( point group) has a character table that couples irreducibly to the spherical harmonic space. The first non-trivial icosahedral representation to appear in the decomposition of spherical harmonics is at , where the representation becomes active. All lower multipoles () have zero icosahedral projection weight. This means:
- If the vacuum is an icosahedron, the dominant anisotropy signal must appear in .
- Any observed power in through would directly falsify this specific symmetry claim.
21.2.2 The 15-Angle Icosahedral Mask
The icosahedral vacuum lattice predicts enhanced cross-power at a unique set of 15 characteristic pair angles. A direct computation of the icosahedral projection yields the precise angular sequence: 0°, 36°, 60°, 72°, 90°, 108°, 120°, 144°, 180° (primary unique angles).
This discrete, -derived angular structure provides a rigid fingerprint that is entirely distinct from the smooth isotropic Hellings-Downs curve.
21.3 Observational Program
21.3.1 NANOGrav 15-Year Dataset (Immediate Testability)
[!IMPORTANT] OBSERVATIONAL STATUS — Sub-Threshold for Current PTAs
The GCT anisotropy prediction sits roughly an order of magnitude below the NANOGrav 15-year sensitivity floor (which reaches in ) and is comparable to the projected SKA-PTA angular-power sensitivity of . Direct detection therefore awaits SKA-PTA timescales rather than existing NANOGrav data. The icosahedral 15-angle template-stacking approach described in §21.3.2 brings the multi-array combined sensitivity from to within reach of the same scale, but a confident detection still requires SKA-class instruments. Pre-registration on arXiv is mandatory before data inspection.
The NANOGrav 15-year dataset (Agazie et al. 2023) has confirmed the Hellings-Downs correlation at high statistical significance, establishing the existence of the SGWB. The anisotropy prediction ( [Tier 2 harmonic-form mechanism + Tier 3 amplitude pending O.15(b)]; derivation in §21.1.3) is below current PTA sensitivity, requiring SKA-PTA-era sensitivity for direct detection.
GCT additionally predicts enhanced cross-power at exactly the 15 characteristic icosahedral angles (0°, 36°, 60°, 72°, 90°, 108°, 120°, 144°, 180°). Applying this specific discrete angular mask to the existing NANOGrav 15-year dataset tightens the test relative to a blind spherical harmonic extraction by concentrating the signal into a finite set of bins, but the projected combined-array stacked sensitivity () remains above the predicted linear-power signal . The 15-angle mask therefore tightens the null test ("if no power lands at the icosahedral angles, the icosahedral vacuum is falsified at sensitivity ") without yet enabling positive detection at current arrays.
Falsification [Tier 2]: The GCT prediction is falsified if applying the 15-angle icosahedral mask to a future PTA dataset of sufficient sensitivity (SKA-PTA-class, [Tier 3 — instrumental sensitivity projection]) yields no statistically significant enhancement in cross-power relative to off-angle baseline pairs.
[!TIP] For theorists analyzing NANOGrav data: Decompose the observed correlation function into spherical harmonic multipoles and specifically extract . The linear-in- GCT prediction is ; the squared angular-power-ratio prediction is . Both are below current NANOGrav-15yr stacked sensitivity but within the SKA-PTA target band.
21.3.2 Multi-Array Combined Analysis — 12–18 Month Program
The GCT prediction can be tested with existing data using a targeted multi-array approach, without waiting for SKA (projected 2030+).
Available Datasets:
- NANOGrav 15-year dataset: 67 millisecond pulsars, timing baseline 1993–2020 (Agazie et al. 2023)
- PPTA DR3: 30 pulsars, CSIRO/Parkes, independent calibration
- EPTA DR2: 25 pulsars, European array, independent noise model
Analysis Protocol:
Step 1 — Independent extraction per array: For each dataset independently, decompose the observed correlation function into Legendre multipoles using: Extract and its error bar. Confirm are consistent with zero (necessary for icosahedral vacuum claim).
Step 2 — 15-angle icosahedral mask application: Apply the icosahedral angular mask by binning pulsar-pair cross-correlations within of each mask angle. Compute the signal-to-noise ratio of the stacked signal versus off-mask baseline pairs.
Step 3 — Joint Bayesian combination: Combine the three independent estimates using a joint Bayesian analysis with common signal model and independent noise models per array. The combined measurement from all three arrays achieves stacked sensitivity (estimated from pulsar pair count total pairs) — roughly above the GCT prediction. Confident positive detection therefore awaits SKA-PTA; the stacked combined-array analysis instead delivers a sharper null test at the same scale.
Step 4 — Pre-registration before execution: The full analysis protocol (code, pipeline, blinding procedure, and statistical threshold for a positive detection) must be deposited as an arXiv Methods Preprint before the correlation function data is inspected.
Timeline: 12–18 months from protocol pre-registration to publication, using existing public datasets. No new observations required.
Detection threshold: A joint across all three arrays constitutes a positive detection. A joint upper bound at constitutes a falsification of the icosahedral vacuum at the PTA scale.
21.3.3 SKA-PTA (Next Generation)
The Square Kilometre Array (SKA) is projected to reach angular power spectrum sensitivity at the level [Tier 3 — instrumental projection], providing roughly a factor of improvement in multipole resolution over current PTAs. At SKA-PTA sensitivity of [Tier 3 — instrumental projection] the GCT prediction sits at the per-pulsar-pair detection threshold: a confident detection requires either improvements in raw single-pair noise (factor below SKA baseline) or substantial multi-pair stacking gains via the 15-angle icosahedral mask. A first marginal detection at per-pair is plausible at SKA baseline; high-significance detection awaits post-SKA arrays (CHIME-PTA, SKA-2, or extended SKA timing baselines) [Tier 4 — order-of-magnitude forecast].
21.3.4 Falsification Protocol
[!CAUTION] Falsification Condition: If the SKA-PTA angular power spectrum reaches precision and observes:
- No statistically significant power at , OR
- Significant power at inconsistent with icosahedral symmetry,
then the GCT quasicrystalline vacuum metric is definitively falsified.
This is an explicit, quantitative, and near-term falsification test. It gives GCT extraordinary relevance in the current era of PTA discovery.
21.4 Analysis Pipeline: NANOGrav 15yr l=6 Search
The identification of the anisotropy as the primary icosahedral fingerprint allows for an immediate test of GCT using existing public data. The analysis pipeline (see Appendix Q) follows these steps:
- Template Generation: Construct the icosahedral angular correlation template .
- Harmonic Filtering: Apply a high-pass filter to the NANOGrav 15-year cross-correlation residuals to isolate the power spectrum.
- Template Fit: Perform a maximum-likelihood fit of the GCT template to the filtered residuals.
- Significance Testing: Compute the Bayes factor comparing the GCT-anisotropic model to the isotropic Hellings-Downs baseline.
Detection Threshold: A Bayes factor (Strong Evidence) constitutes a Tier 2 validation of the vacuum geometry.
21.5 The Velocity Field of the Icosahedral Vacuum
21.5.1 Physical Mechanism
The GW anisotropy arises because the icosahedral lattice acts as an anisotropic acoustic medium. The gravitational wave tensor evolves according to the linearized Einstein equations on a piecewise-flat quasicrystalline background. The effective metric perturbation receives a correction from the phason field gradient:
where is the unit wave vector and is the icosahedral ellipticity. When integrated over the isotropic background distribution of GW sources, any residual anisotropy in the medium's response function produces a measurable angular correlation signature—precisely the correction to the Hellings-Downs curve.
21.5.2 Frequency Independence
Scale-free prediction: The l=6 anisotropy is a property of the spatial structure of the icosahedral vacuum lattice, not of the temporal spectrum of the GW background. The correction δΓ(θ) = ε · P₆(cosθ) applies at all GW frequencies where the wavelength is shorter than the lattice correlation length (i.e., all frequencies accessible to PTAs, from nHz to μHz). The anisotropy is therefore frequency-independent at leading order. This is a falsifiable prediction: if PTA observations reveal a frequency-dependent anisotropy (e.g., stronger at higher frequencies), a static lattice origin would be disfavoured.
21.5.3 Phase Velocity Dispersion: Observational Test via Binary Pulsar Timing [Tier 2]
Correlated Prediction: Phase Velocity Dispersion The l=6 spatial anisotropy alone is necessary but not sufficient to confirm the phason-graviton identification. This section adds a correlated prediction without introducing an additional fitted coefficient: the phase velocity dispersion across the NANOGrav frequency band.
The Core Argument. Section §21.1.3 identifies the graviton as a phason of the discrete icosahedral vacuum lattice. For a continuous, isotropic medium, phasons propagate at exactly with no dispersion. However, the GCT vacuum is discrete (lattice spacing at the 6D projected scale) and anisotropic (icosahedral symmetry). Both properties introduce frequency-dependent corrections to the phason group velocity. These corrections must be correlated with the spatial anisotropy through the same single parameter : if is present, dispersion must be present at the level predicted below. If dispersion is absent while is confirmed, the phason-graviton identification is falsified.
Dispersion Relation for the Phason-Graviton. In a discrete lattice with projected 3D spacing (related to the 6D lattice constant by the icosahedral cut-and-project), the phason dispersion relation is:
where is the angle of propagation relative to the nearest five-fold axis, and is the phason speed along the principal axis. At long wavelengths (), this Taylor-expands to:
The second term is the spatial anisotropy already predicted in §21.1.2 (amplitude ). The third term is the dispersive correction from lattice discreteness.
The 3D Projected Lattice Scale. The 6D parent lattice has spacing set by the electron Compton wavelength via the cage structure:
The 3D projected lattice spacing is m (at the quark confinement scale). At PTA gravitational wave frequencies Hz, the wavenumber is m, giving:
The lattice dispersive correction at Planck/quark scales is thus negligible at current PTA frequencies. However, GCT's icosahedral vacuum also possesses a cosmological-scale correlation length related to the BAO horizon ( Mpc m), below which the phason correlation is coherent. At the BAO scale, the effective IR-regulated lattice spacing for long-wavelength phasons is , and:
This is , meaning the PTA frequency band is above the IR lattice cutoff and the dispersion is in the strong-regime. The correct dispersive correction in this regime is non-perturbative; however, using the phase velocity at the BAO boundary:
where Hz. In the PTA band (), the sinc function oscillates rapidly, but averaged over the BAO-scale structure, the effective phase velocity dispersion between frequency bins Hz and Hz is:
This is an fractional phase velocity variation across the two-decade NANOGrav frequency band — potentially detectable as a frequency-dependent arrival-time residual in the timing data.
The Correlated Prediction (Shared Geometric Control). The amplitude of the spatial anisotropy and the amplitude of the dispersive phase delay are both controlled by the same stiffness ratio :
where is the pulsar distance and is a dimensionless function of the PTA and BAO frequencies. For a pulsar at kpc m and :
[!WARNING] [Tier 4 — Known Tension] This estimate yields a 9-second timing residual, which is times larger than the nanosecond precision of current PTA arrays. No such anomaly is observed. The magnitude discrepancy indicates that the BAO-scale IR cutoff identification ( Mpc) likely overestimates the effective phason correlation length relevant to PTA frequencies by many orders of magnitude. The qualitative prediction (frequency-dependent dispersive signature from lattice discreteness) remains well-motivated [Tier 2]; the quantitative magnitude is unreliable [Tier 4] and is flagged as Open Problem O.X pending a first-principles derivation of the IR phason correlation scale. The numerical chain above should be treated as illustrative, not predictive.
[!CAUTION] Epistemics of the BAO-Scale Cutoff. The derivation above uses the BAO horizon as the IR phason correlation length. This is a Tier 3 assumption (the IR regulator scale is not derived from first principles in the current manuscript; it is an order-of-magnitude estimate). The Tier 2 content is the form of the correlation: if spatial anisotropy is detected at amplitude , then frequency-dependent dispersion at amplitude must also be present. The exact numerical value of depends on the IR scale identification (open research, App. Z-6).
The Qualitative Correlated Test for SKA. The correlated nature of the spatial and frequency observables provides a qualitative correlated test, not a numerical binary falsification gate at the current level of disclosure. The boxed structural relation states only the form of the correlation between the spatial signal and the frequency-dependent dispersion; the absolute magnitude depends on the IR phason correlation length, which is not currently derived from first principles (the BAO-horizon identification leads to the 9-second overestimate explicitly flagged Tier 4 above). The qualitative correlated test is therefore:
| Observation | Implication |
|---|---|
| spatial anisotropy detected at | Tier 2 spatial-signature confirmed (the primary operational binary test of this protocol) |
| detected, frequency-dependent dispersion present and correlated with the same icosahedral orientation | GCT phason-graviton identification supported (qualitative; quantitative magnitude pending IR phason correlation-length closure) |
| detected, no frequency-dependent dispersion at any detectable level after full SKA-PTA matched-filter analysis | Phason-graviton identification weakened (does not falsify the spatial-signature claim, but disfavours the propagating-phason-as-graviton mechanism) |
| absent at SKA-PTA sensitivity | GCT icosahedral vacuum falsified at PTA scale |
The numerical-binary-test framing (with the "dispersion detected at level" target) is outside the closed numerical scope until the IR phason correlation scale is derived (Open Problem O.X, App Z-6); the operationally meaningful Tier 2 binary test is the spatial deviation itself, which is the primary P.I.PTA registered prediction (§21.7). The SKA-PTA, with its pulsar timing baselines at nanosecond precision, will have sensitivity to the spatial power as a clean Tier 2 binary test; the frequency-dispersion correlated prediction is a qualitative second-channel cross-check whose quantitative magnitude target is pending O.X closure.
Scope of the boxed formula [structural, not numerical]. The boxed structural relation above states that if the spatial signal is present, the GCT framework also predicts a frequency-dependent dispersion correlated with it. The boxed factors (, , ) are the form of the correlation, not a closed-form numerical prediction: substituting standard PTA values (, nHz, Hz, s) gives s — clearly non-physical, mirroring the same BAO-IR-cutoff overestimate that produced the 9-second figure in §21.5.3 above. This boxed expression is therefore illustrative only and inherits the same Tier 4 disclosure: the IR phason correlation scale is not the BAO horizon, and the substituted form does not produce the actual GCT binary-test target.
The operationally relevant binary-test target is the spatial angular-correlation deviation itself (Ch21 §21.1.3 boxed Tier 2 prediction; FM matrix rows P.7c-e), accessible to SKA-PTA matched-filter at angular-correlation sensitivity. The frequency-dependent dispersion at the geometrically-rescaled level of relative to the spatial signal is the form of the GCT correlation, but its absolute magnitude depends on the IR phason correlation length — a quantity not yet derived from first principles in the framework. Closure of the IR cutoff scale (Open Problem O.X, App Z-6) would convert the boxed structural relation into a numerical sub-nanosecond prediction. Until then, the binary-test claim is qualitative (correlation between spatial and frequency-dispersion at the same scale), not numerical.
21.6 Protocol I-bis: SDSS DR16 Quasar Angular Power Spectrum Test
21.6.1 Primordial Density Fluctuations in a Topological Glass
The same icosahedral geometric signature that produces the Pulsar Timing Array (PTA) prediction must appear as an anomalous excess in the Large Scale Structure (LSS) of the universe. While the PTA signal probes the current-epoch vacuum via gravitational wave propagation, the SDSS quasar distribution probes the primordial fingerprint of the vacuum.
In the early universe, specifically during the epoch of Baryon Acoustic Oscillations (BAO), primordial density fluctuations propagated as sound waves through the hot, dense plasma. In GCT, this plasma was not expanding through a smooth vacuum, but through the structured Topological Glass of the icosahedral lattice.
21.6.2 The Anisotropic Speed of Sound
Because the icosahedral vacuum is an anisotropic acoustic medium, the speed of sound in the primordial plasma was infinitesimally dependent on the direction of propagation relative to the 6-fold axes of the parent 6D lattice:
where represents the icosahedral symmetry axes. This anisotropy, though small (), was "frozen in" during the decoupling of matter and radiation. It imprints a permanent harmonic on the spatial distribution of galaxies and quasars.
21.6.3 Pre-registration and Falsification
By analyzing the angular power spectrum of the SDSS DR16 Quasar Catalog (~750,000 objects), we can test for this specific icosahedral excess. The GCT prediction is strictly mathematically aligned with the PTA prediction:
This is a parameter-accounted geometric prediction within the stated Ledger sector: the harmonic form is Tier 2, while the specific amplitude inherited by the squared ratio is Tier 3 pending O.15(b). Any statistically significant detection of power at this amplitude, aligned with the 15-angle icosahedral mask, supports the mechanism and measures the amplitude branch. Conversely, the absence of this feature in the high-redshift limit (where non-linear growth is minimized) would provide a significant falsification constraint on the phason-coupling strength in the early universe.
21.7 Pulsar Timing Array Falsification Protocol
[!IMPORTANT] Pulsar Timing Array Falsification Protocol
Prediction ID: P.I.PTA Datasets: NANOGrav 15yr (Agazie et al. 2023) + PPTA DR3 + EPTA DR2 Blinding Protocol: Full analysis pipeline code must be deposited as arXiv Methods preprint BEFORE correlation data is inspected. arXiv timestamp = official preregistration date.
Exact Prediction: A joint Bayesian analysis of the three datasets using the 15-angle icosahedral mask (§21.2.2) will yield combined ℓ=6 angular power coefficient:
Squared angular-power-ratio coefficient: Linear Legendre projection coefficient: Peak correlation deviation: (achieved at ) (Note: These three quantities are distinct — the squared ratio, the linear projection, and the peak deviation respectively. See §21.2 for the conversion formula. Published comparisons must specify which normalization is in use.)
Statistical Decision Criterion: Detection if Ĉ₆ / σ(Ĉ₆) ≥ 3.0 (joint Bayesian posterior). Null Hypothesis: The Hellings-Downs correlation is isotropic; ℓ≥1 multipoles are consistent with zero at 2σ. Falsification Condition: If the 15-angle icosahedral mask applied to the combined dataset yields |Ĉ₆| < 10⁻⁴ at > 3σ significance, the icosahedral vacuum claim (Tier 2, Vol. 2 §1.3) is definitively falsified. Complementary null: Any significant power at ℓ < 6 falsifies icosahedral symmetry independently of the ℓ=6 measurement.
Pipeline Specification (to be deposited on arXiv): See §21.3.2 for the complete analysis methodology including: (a) Legendre multipole extraction: Ĉ_l = [(2l+1)/2] ∫ Γ̂(θ) P_l(cosθ) d(cosθ) (b) 15-angle icosahedral mask: θ_icos = {0°, 36°, 60°, 72°, 90°, 108°, 120°, 144°, 180°} (c) Joint Bayesian combination across three independent noise models (d) p < 0.001 detection threshold (pre-committed)
Derivation provenance: The amplitude is a Tier-3 anchor: the integer exponent is one of the 5 core integer postulates (P3), and the RG-running claim awaits O.15(b) closure. The harmonic form follows from the icosahedral harmonic fingerprint theorem (§21.2.1) and the emergent graviton identification (Volume 2 Chapter 8). The yield strain derivation (V3 Ch11 §11.1) confirms that the same amplitude branch is used consistently across the 3.55 keV threshold and this PTA signal, but the amplitude is not a fully closed continuum prediction until O.15(b) closes.
21.8 Protocol I-quart: Kinematic Sunyaev-Zel'dovich Icosahedral Tomography [Tier 2 mechanism + Tier 3 amplitude pending O.15(b)]
21.8.1 Physical Basis
The icosahedral shear modulus of the topological glass vacuum (Volume 2 §11.1) generates a preferred set of six propagation axes in the vacuum phonon-phason field. Galaxy clusters moving with bulk peculiar velocities relative to the CMB rest frame scatter CMB photons via the Kinematic Sunyaev-Zel'dovich (kSZ) effect. In a standard isotropic vacuum, the resulting temperature anisotropy is a dipole on the sky aligned with the cluster's peculiar velocity. In the GCT icosahedral vacuum, the bulk flow itself is constrained by the anisotropic resistance tensor of the topological glass: cluster motion is preferentially organized along the six icosahedral shear directions of the 3D projection.
21.8.2 The l=6 Azimuthal Vorticity Prediction [Tier 2]
The icosahedral shear modulus tensor (V2 Ch04 §4.1.3) has precisely six independent principal shear directions in the 3D projection, corresponding to the six five-fold axes of the icosahedron projected onto the physical manifold. This forces the bulk flow velocity field of galaxy clusters, when decomposed into spherical harmonics, to exhibit a dominant azimuthal vorticity component:
The amplitude is set by the same disclosed icosahedral stiffness-ratio branch that governs the PTA anisotropy (§21.1.2), the FRB DM/RM fingerprint (§21.11), and the SDSS quasar angular power spectrum (§21.6). This multi-messenger internal consistency adds no fitted amplitude, but the shared specific amplitude remains a Tier 3 branch pending O.15(b).
21.8.3 Observable Signature
The kSZ temperature anisotropy from a cluster at position with line-of-sight velocity is:
where is the optical depth to Thomson scattering. The GCT prediction is that the azimuthal decomposition of across a large cluster sample shows a statistically significant excess at with amplitude:
(Numerical value consistent with the PTA peak-deviation form and the PTA linear-projection , both linear-in-.)
This vorticity signature is strictly forbidden in standard CDM cosmology, where bulk flows have no preferred multipole beyond the dipole () from the CMB frame. Detection of power in the kSZ vorticity field would uniquely fingerprint the icosahedral vacuum topology.
Normalization note (clarifying the four predictions in this chapter): The full disambiguated set is:
- PTA peak deviation: (linear-in-, §21.1.2);
- PTA linear Legendre projection: (linear-in- angular projection, §21.7);
- PTA squared angular-power-ratio: (quadratic-in-, §21.7);
- kSZ velocity-field cross-power: (linear-in- — kSZ is the velocity-temperature cross-correlation, linear in the source field; same scaling as the PTA peak deviation, present subsection).
SDSS quasar (§21.6) and FRB DM/RM (§21.11) predictions are (same quadratic form as the squared PTA angular-power-ratio, since these are scalar power-spectrum observables). All five predictions follow from the single disclosed GCT amplitude branch with no additional fitted amplitudes; the specific branch remains Tier 3 pending O.15(b).
21.8.4 Testability: CMB-S4 and Simons Observatory
This prediction is testable by two next-generation CMB experiments:
-
Simons Observatory (2025–2030): The cluster sample from SO's galaxy cluster catalog, combined with spectroscopic redshifts from DESI, will enable the first all-sky kSZ velocity reconstruction with sufficient signal-to-noise to probe azimuthal structure at the amplitude.
-
CMB-S4 (2028–2035): With clusters and arcminute-resolution kSZ maps across the full sky, CMB-S4 will achieve definitive sensitivity. The GCT prediction requires that the kSZ vorticity be spatially aligned with the PTA gravitational wave anisotropy (§21.1.2) and the FRB DM fingerprint (§21.11) — all three observables must point to the same icosahedral orientation.
21.8.5 Falsification
| Outcome | Implication |
|---|---|
| kSZ vorticity detected, aligned with PTA | Icosahedral vacuum confirmed across three independent channels |
| kSZ present but misaligned with PTA | New anisotropic physics, not GCT icosahedral |
| kSZ absent at level in CMB-S4 | GCT icosahedral shear modulus falsified at cluster scales |
Tier label. The harmonic structure is Tier 2 because it is a direct consequence of the icosahedral vacuum representation. The specific amplitude is Tier 3 pending O.15(b), matching the PTA and FRB amplitude branch. The kSZ channel adds a fully independent, cross-correlated falsification test at cosmological scales.
21.9 Protocol I-ter: CMB B-Mode -Birefringence
21.9.1 Azimuthal Anisotropy in the Early Universe
If the vacuum is an icosahedral projection, the phase velocity of light is not uniquely determined by the global scale factor, but depends on the orientation of the polarization vector relative to the 6D lattice axes. In the early universe, this imprints a unique signature on the Cosmic Microwave Background (CMB).
21.9.2 The 6-Fold Birefringence Signature
GCT predicts that the CMB must exhibit a strict 6-fold azimuthal variation () in its polarization angle. As the photon travels through the anisotropic phason vacuum, its polarization plane undergoes a geometric rotation (birefringence) that tracks the symmetry of the underlying lattice.
21.9.3 Experimental Validation: Simons Observatory
This prediction is specifically targeted at the Simons Observatory and future CMB-S4 experiments. Because the icosahedral signal is topologically locked to the harmonic, it is observationally distinct from standard gravitational lensing or primordial tensor modes. A detection of this 6-fold birefringence would provide the first direct evidence of the quasicrystalline structure of the vacuum during the epoch of recombination.
21.9.4 CMB B-Mode Polarization Curl (Stokes-V)
Furthermore, if gravitational waves are indeed chiral phasons of the vacuum lattice, early universe SGWB must exhibit a net helicity. This chiral phason-GW interaction pre-registers a parity-violating B-Mode Polarization Curl (Stokes-V) signature on the Cosmic Microwave Background (CMB).
Specifically, this net helicity will correlate precisely with the icosahedral axes. This constitutes an immediate falsifiable prediction: a structured parity violation in the CMB B-modes aligned with the 15-angle icosahedral mask. This specific geometric signature is testable by the upcoming LISA mission and CMB-S4 experiments, providing a definitive probe of the vacuum's chiral quasicrystalline nature.
21.10 Protocol J: Directional Bell Inequality (Macroscopic Entanglement Anisotropy)
21.10.1 Entanglement in the Anisotropic Vacuum
A fundamental premise of GCT is that the vacuum possesses 10 three-fold symmetry axes (the icosahedral projection cut) and that the maximal wave speed is anisotropic at the level. If spacetime is fundamentally an icosahedral quasicrystal rather than an isotropic Minkowski manifold, it follows that quantum entanglement collapse—"spooky action at a distance"—must also inherit this structural anisotropy.
21.10.2 The Prediction
When entangled photon pairs are measured across large spacelike baselines, the timing or correlation strength of the wavefunction collapse will not be perfectly rotationally isotropic. We predict a statistically significant violation of rotational isotropy in Bell inequality experiments.
Critically, this violation will not be random. It must align exactly with the 15-angle icosahedral mask ( signature) that governs the PTA gravitational wave prediction and the CMB B-Mode curl.
21.10.3 Formal Pre-Registration
A detection of directional bias in macroscopic Bell inequality violations matching the 15-angle set would constitute profound, independent verification of the icosahedral vacuum acting upon quantum wavefunctions. An observation of perfectly isotropic entanglement collapse over large baselines across all angles would constitute a falsification of the macroscopic mechanical nature of the quasicrystal limit.
21.11 Protocol K: Fast Radio Burst DM/RM Icosahedral Anisotropy [Parametric Closure 3]
Pre-Registered Prediction: Icosahedral Fingerprint in FRB DM/RM Pre-registered prediction for the icosahedral l=6 fingerprint in FRB Dispersion Measures and Faraday Rotations. This sector is stated within the 5-postulate-plus-1-anchor bare gauge+lepton sub-sector of Parameter Ledger §0.1, expanding to 5-postulate-plus-3-anchor when native-RGE endpoint and measurement-anchored precision-comparison rows are included. Testable now with CHIME/FRB.
21.11.1 The Physical Mechanism
Fast Radio Bursts (FRBs) are millisecond-duration radio transients originating at cosmological distances. As they traverse the intergalactic medium and the Milky Way, two effects accumulate:
- Dispersion Measure (DM): — the integrated free electron column density along the line of sight.
- Faraday Rotation Measure (RM): — the integral of electron density times the line-of-sight magnetic field component.
Both integrals are sensitive to the electron scattering cross-section and photon propagation speed through the vacuum. In the GCT framework, the icosahedral vacuum anisotropy modulates the effective vacuum refraction index at the level, imposing a geometric pattern on the integrals. The DM and RM of extragalactic FRBs, when the standard Milky Way and host galaxy contributions are subtracted, will retain a residual all-sky anisotropy with the icosahedral harmonic fingerprint.
21.11.2 The FRB Harmonic Prediction
[!IMPORTANT] FRB Harmonic Prediction — P.I.FRB-L6
Prediction ID: P.I.FRB-L6 Dataset: CHIME/FRB Catalog 1 (536 FRBs), CHIME/FRB ongoing (>2000 FRBs) Future Instrument: DSA-2000, HIRAX, SKA FRB survey (>10⁵ FRBs)
Exact Prediction: The angular power spectrum of all-sky extragalactic FRB DM residuals (after subtracting standard Milky Way electron density model NE2001 or YMW16 and host galaxy DM estimate) will exhibit:
DM angular power: RM angular power:
Both aligned with the 15-angle icosahedral mask:
Correlated Internal Predictions (Ledger-accounted sector):
- The orientation in the FRB DM map must be the same orientation as the PTA anisotropy (P.I.PTA). Both probe the same icosahedral vacuum.
- The pattern in the Faraday RM map must have opposite sign structure to the DM map, mandated by the coupling of the magnetic B-field component to the stiffness tensor parity.
- Multipoles must be consistent with zero at in both DM and RM (icosahedral symmetry projects only to at lowest order).
Statistical Decision Criterion: Detection if in a catalog of sky-distributed FRBs. Falsification Condition: If at in a >5000 FRB catalog with good sky coverage, the icosahedral vacuum anisotropy is falsified at the FRB scale.
21.11.3 Why FRB Dispersion Measure and Rotation Measure Constitute Decisive Observational Tests
The FRB DM/RM prediction is exceptional among GCT falsification targets for three reasons:
- Multi-messenger corroboration: It tests the same stiffness ratio as the PTA prediction and the Bell anisotropy, using an entirely independent observational probe (radio dispersion rather than gravitational wave correlation).
- Near-term testability: CHIME/FRB is currently cataloguing hundreds of FRBs per year. A >5000 FRB catalog with precise localization enabling host DM subtraction is achievable within 3–5 years, well before SKA.
- Correlated cross-check: The DM and RM predictions are mutually correlated through the stiffness tensor. If the DM is detected, the RM sign structure is a free prediction. If the RM sign structure is wrong, the stiffness tensor parameterization is falsified.
[!CAUTION] Foreground Systematics: The dominant challenge for this measurement is accurate subtraction of the Milky Way DM contribution (dominated by HII regions and the warm ionized medium). The FRB DM residual after NE2001/YMW16 subtraction retains ~10% systematic uncertainty. The GCT prediction () lies well below the current foreground residual variance (~1%). This test requires either (a) using FRBs with measured host DM from very-long-baseline interferometry localization, or (b) statistical cancellation of the foreground by cross-correlating with the independently-measured Galactic electron density map.
21.11.4 Binary Falsification Gate
| Observation | Implication |
|---|---|
| DM detected, RM sign-correct, orientation = PTA orientation | GCT icosahedral vacuum triple-confirmed ✓ |
| DM detected, RM sign-wrong | Stiffness tensor parameterization falsified |
| DM detected, orientation ≠ PTA orientation | Icosahedral identity between DM and GW probes falsified |
| absent at in FRB catalog | GCT icosahedral vacuum anisotropy falsified at FRB/IGM scale |